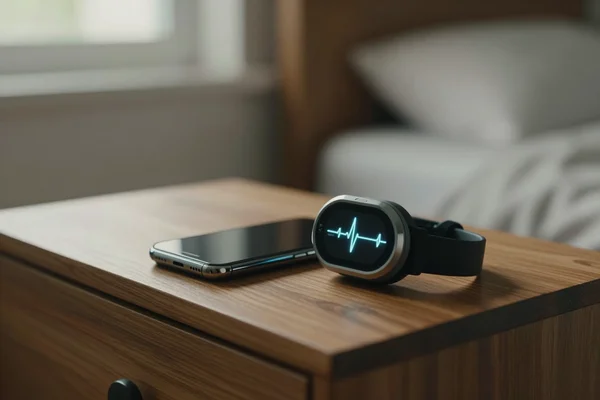
Your ring reports 34 out of 100, your watch says you are recovered. Both measured the same body on the same night. Which number is right, nobody can tell you, because no manufacturer discloses how it calculates.
Is There a Readiness Score? Yes, Fourteen of Them
 Christopher Klenk8 min read
At a glance
Fourteen readiness and recovery scores from ten manufacturers draw on the same four signals, but not one of them discloses how it weights them. Even the ingredients are inconsistent: what one manufacturer calls resting heart rate, another measures differently. At night and lying still the devices measure well, and the differences between them come from the processing, not the form factor. What that means for you: treat the number as a hint, not a measurement. What you can genuinely track are HRV and resting heart rate as raw values.
Stay on top of AI training & analysis? One click — and Google shows you my articles first.
Add as a preferred source on GoogleWhat you are being sold
Ten manufacturers sell fourteen different answers to the same question. A 2025 review in Translational Exercise Biomedicine catalogued what is on the market: Fitbit Daily Readiness, Garmin Body Battery and Training Readiness, Oura Readiness and Resilience, WHOOP Strain, Recovery and Stress Monitor, Polar Nightly Recharge, Samsung Energy Score, Suunto Body Resources, Ultrahuman Dynamic Recovery, Coros Daily Stress, Withings Health Improvement Score.
The ingredients are remarkably consistent: heart rate variability sits in 86 percent of these scores, resting heart rate in 79, activity and sleep duration in 71 percent each.
They diverge where you cannot see it. No manufacturer discloses how heavily it weights which signal, over what window it calculates, or by what rule that becomes a number. Only a few supply peer-reviewed evidence of accuracy or clinical relevance at all. One of the review's co-authors is Marco Altini, the man behind HRV4Training, so this is not criticism from the outside.
The ingredients are on the packaging, the recipe is not. That is why ring and watch contradict each other on the same morning, and why nobody can tell you why your number is 34 today. How far apart implementations of the same concept can drift also shows in a study of 206 HRV apps.
Even the ingredients are not the same
Resting heart rate is not the same resting heart rate everywhere. A validation of five wearables had to exclude the Garmin Fenix 6 from the resting heart rate analysis because the device defines it as the lowest 30-minute average across an entire day. That is a different quantity from what the other devices report.
Same picture for the measurement technique. The third-generation Oura ring samples at 250 hertz. Garmin does not state its sampling rate, writing instead that it depends on activity level.
Sleep, too, is more estimate than measurement. The devices detect that you are asleep well, lying awake poorly: the hit rate for wake phases ranged between 41 and 60 percent in one review. A meta-analysis across 24 studies found measurable deviations from sleep-lab measurement for sleep duration, sleep efficiency, time to fall asleep and nocturnal wake phases.
Only 17 percent of devices with an optical sensor disclose how they determine sleep stages. And sleep duration sits in 71 percent of the scores. One of the four ingredients is therefore itself an estimate whose derivation nobody can look up.
At night and lying still, the devices are good
Where the devices are good, they are really good. A validation funded by the Air Force Research Laboratory compared five wearables against an ECG across 536 nights in 2025. For resting heart rate all of them stayed inside what counts as a clinically relevant deviation, with mean errors below two beats per minute.
For heart rate variability they part ways. The two Oura rings and WHOOP led the field and were statistically level with each other, Garmin and Polar clearly behind. The mean percentage error ranged from just under 6 percent for Oura to over 16 percent for Polar.
The obvious explanation would be the form factor: ring on the finger, less movement, cleaner signal. The data do not support it. WHOOP is worn on the wrist like both watches and still lands with the rings. The break runs right through the wrist group.
So the authors normalised against individual physiology. The error remained. It comes, they conclude, from signal processing, sensor design and data segmentation, not from bodily differences.
It is not the sensor that decides, it is what the device does with the signal afterwards. That appears in no product description.
One caveat belongs here: measurements were taken lying down, averaged across the whole night, in thirteen people. It says nothing about daytime measurement or exertion.
There was a general score once
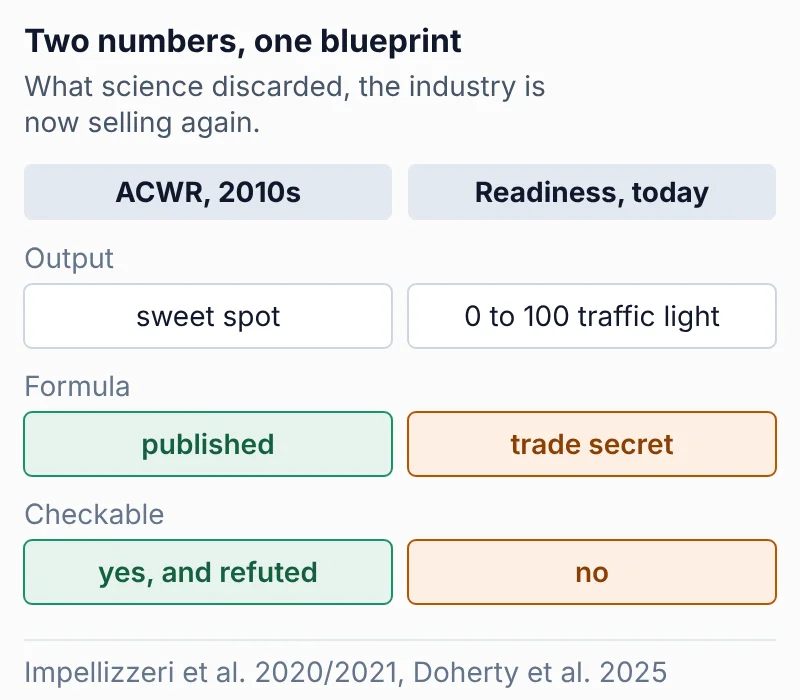
When a formula is out in the open, it can be refuted. That is exactly what happened to the only general readiness score there has ever been.
The acute:chronic workload ratio set acute against chronic load and derived a sweet spot from it that you were meant to stay in. For years this was standard in professional sport and in every athlete management system.
Then came the methodological criticism. Impellizzeri and colleagues showed in 2020 that the acute value is contained inside the chronic one, so the two quantities being compared are mathematically coupled. The hardest finding came from the same group: replace the chronic value with a randomly generated one and the association with injuries stays just as strong.
The topic is not closed. July 2026 brought a paper proposing recovery latency as a new readiness marker. The advertised discriminative power comes from a dataset without daily resolution and measures a proxy derived from HRV, not the time-to-baseline in the title.
A score with a secret weighting can never receive that correction. There is nothing anyone could recalculate.
What you do with this
The score is a hint, not a measurement. What you can genuinely track sits underneath it, and three things are enough for that.
Look at the raw values: nightly HRV and resting heart rate appear as a number in almost every app. Compare them against your own history, not against a norm.
Learn your range: write the values down for a few weeks. Then you know how much they normally swing for you, and you only react once one leaves that band for several days.
Ask four questions: sleep, fatigue, stress, muscle soreness, each 1 to 7. Thirty seconds of effort. Background on this: RPE, the marker no watch measures.
That leaves the question that actually comes up in practice: what do you do when the number and how you feel point in different directions?
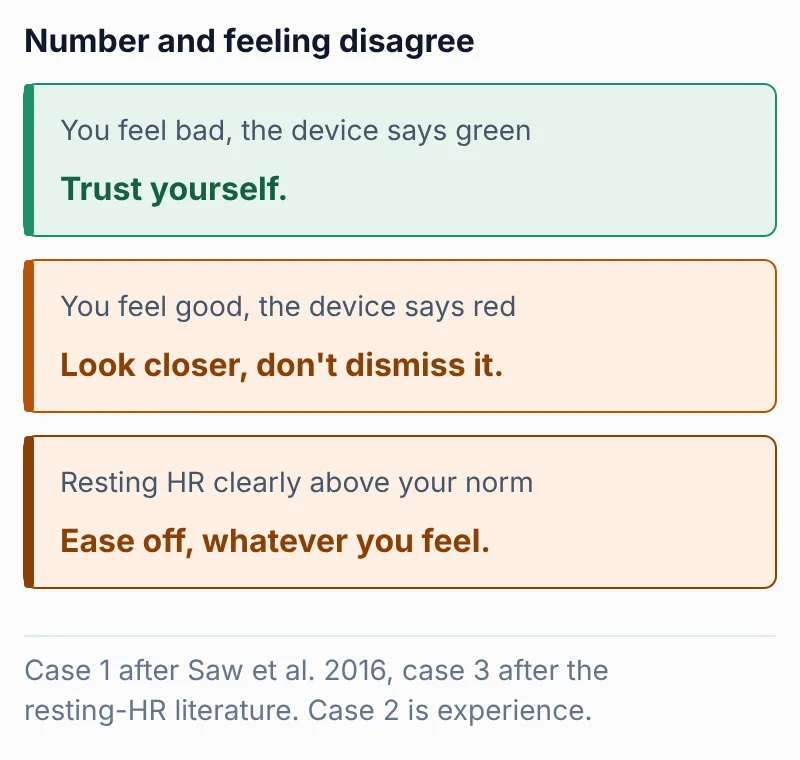
The middle case is the interesting one. The review of 56 studies ran in settings where self-reporting had no consequences. For you it does: anyone training with ambition has a motive to feel fine.
That does not make the device value more accurate than your own sense of things, but it is not chasing a personal best on Sunday. Which makes it useful precisely where you talk yourself into something. This point is not evidence-backed, it is our own read.
With resting heart rate it gets more concrete. A deviation of roughly five to seven beats, or around ten percent above your norm, counts as meaningful in the literature, and a clearly elevated resting heart rate is, in our experience, the earliest sign that something is brewing.
If you train with a chest strap, you can also track DFA alpha 1 for recovery and recalculate it yourself with our DFA alpha 1 calculator. The metric comes from the same beat-to-beat intervals as your HRV, but it is out in the open.
And if you want to know whether your traffic light is worth anything at all, keep parallel notes for two weeks: what the device says in the morning, and how the session then went. If the number always turns out to have been right, no matter how the day ran, then it is not measuring your readiness, it is describing it after the fact.
Sources
Doherty C, Baldwin M, Lambe R, Burke D, Altini M. Readiness, recovery, and strain: an evaluation of composite health scores in consumer wearables. Translational Exercise Biomedicine, 2025. DOI 10.1515/teb-2025-0001
Dial MB, Hollander ME, Vatne EA, Emerson AM, Edwards NA, Hagen JA. Validation of nocturnal resting heart rate and heart rate variability in consumer wearables. Physiological Reports, 2025;13:e70527. DOI 10.14814/phy2.70527
Impellizzeri FM, Tenan MS, Kempton T, Novak A, Coutts AJ. Acute:Chronic Workload Ratio: Conceptual Issues and Fundamental Pitfalls. International Journal of Sports Physiology and Performance, 2020;15(6):907-913. DOI 10.1123/ijspp.2019-0864
Impellizzeri FM, Woodcock S, Coutts AJ, Fanchini M, McCall A, Vigotsky AD. What Role Do Chronic Workloads Play in the Acute to Chronic Workload Ratio? Time to Dismiss ACWR and Its Underlying Theory. Sports Medicine, 2021;51:581-592. DOI 10.1007/s40279-020-01378-6
Birrer V, Elgendi M, Lambercy O, Menon C. Evaluating reliability in wearable devices for sleep staging. npj Digital Medicine, 2024;7. DOI 10.1038/s41746-024-01016-9
Lee YJ, Lee JY, Cho JH, Kang YJ, Choi JH. Performance of consumer wrist-worn sleep tracking devices compared to polysomnography: a meta-analysis. Journal of Clinical Sleep Medicine, 2025;21(3):573-582. DOI 10.5664/jcsm.11460
Saw AE, Main LC, Gastin PB. Monitoring the athlete training response: subjective self-reported measures trump commonly used objective measures: a systematic review. British Journal of Sports Medicine, 2016;50(5):281-291. DOI 10.1136/bjsports-2015-094758
Selmi O, Ouergui I, Muscella A, My G, Marsigliante S, Nobari H, Suzuki K, Bouassida A. Monitoring Psychometric States of Recovery to Improve Performance in Soccer Players: A Brief Review. International Journal of Environmental Research and Public Health, 2022;19(15):9385. DOI 10.3390/ijerph19159385
Silva AA. Recovery Latency as a Dynamic Biomarker of Adaptive Capacity. International Journal of Sports Physiology and Performance, Ahead of Print, 17 July 2026. DOI 10.1123/ijspp.2026-0111
Oura Health. Readiness Score. Manufacturer documentation, support.ouraring.com, retrieved 14 July 2026