Trying to predict fatigue from a single metric misses more often than you would think. Researchers followed 48 college football players for twelve weeks with GPS trackers, heart rate monitors and daily wellness questionnaires — and trained a machine learning model on the combined data that detects fatigue with an AUC of 0.895. Individual indicators come nowhere close.
This is a study on college football players. The underlying logic of the three most important markers, however, transfers directly — and all three can be measured with devices many of you already wear on your wrist.
What the study measured
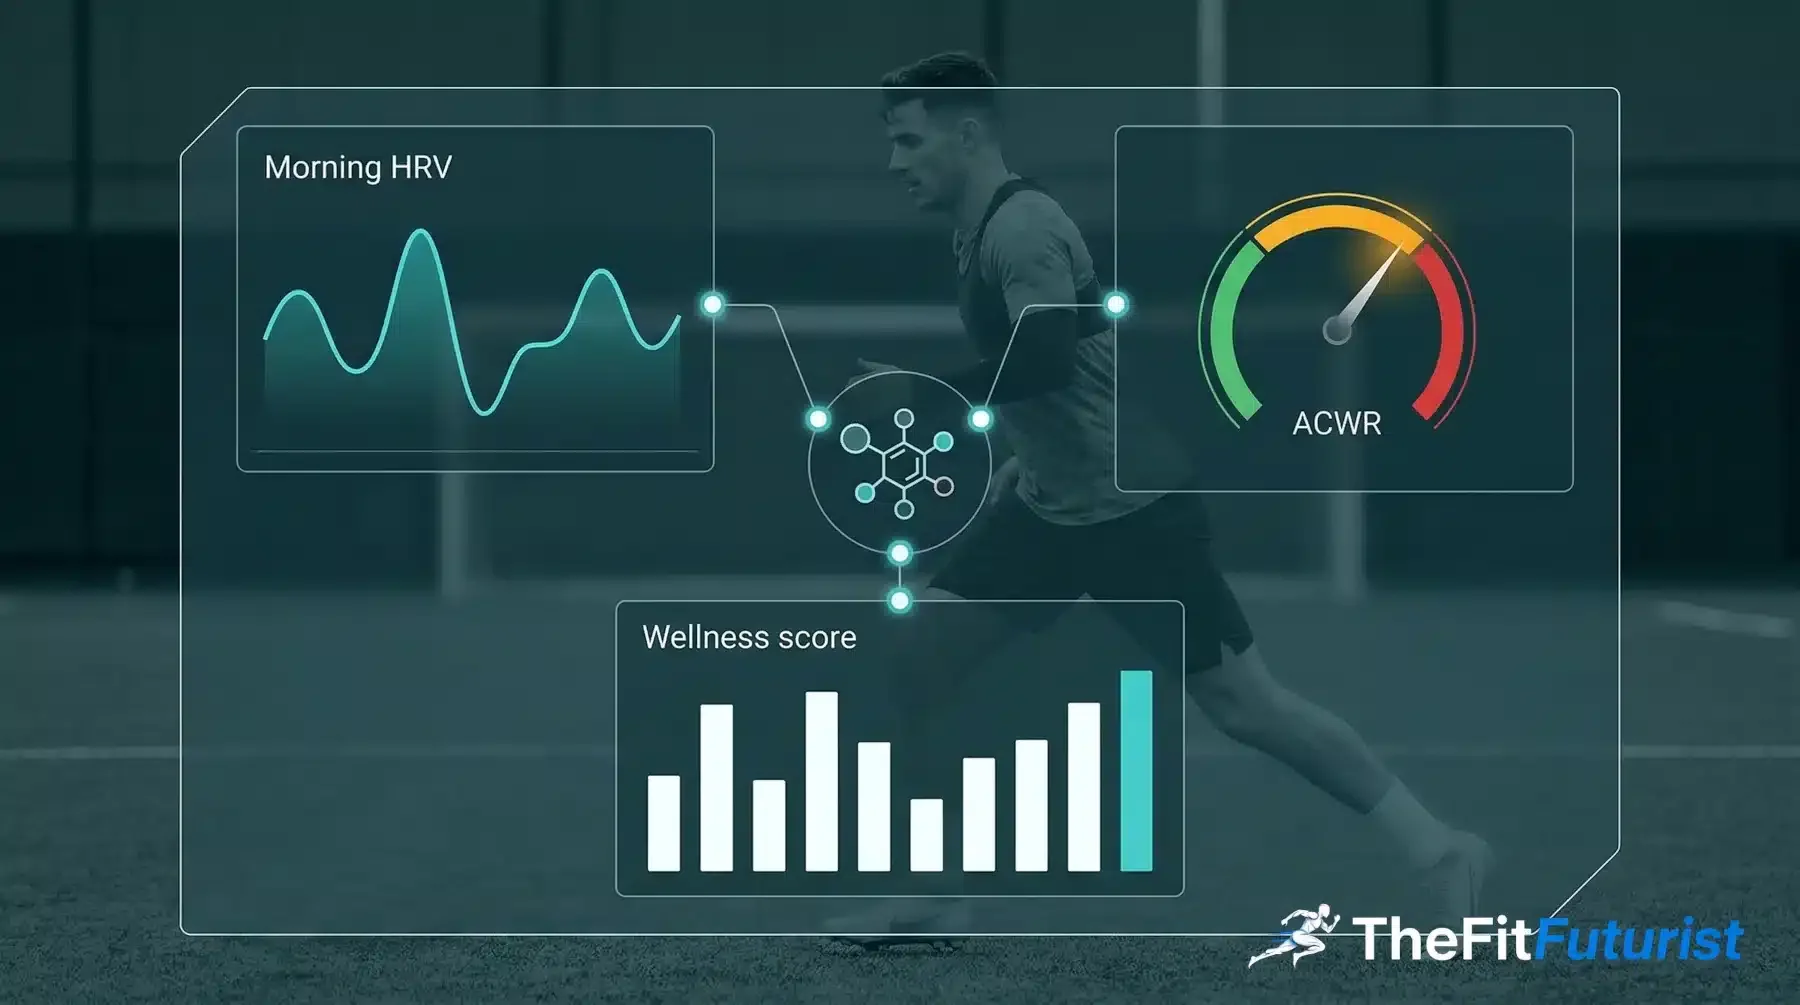
The study (Xu et al., Frontiers in Physiology, February 2026) evaluated 536 training sessions and 24 matches. External load markers such as total distance, Player Load and high-speed running were recorded, together with internal markers such as TRIMP (Training Impulse — a weighted heart rate load value) and RPE (Rate of Perceived Exertion, the subjective sense of effort). Fatigue was defined via four criteria: countermovement jump height (CMJ), heart rate variability (HRV), wellness score and RPE.
Three algorithms were pitted against each other: XGBoost, Random Forest and logistic regression. XGBoost won with an AUC of 0.895. The three most important prediction features were wellness score (18.5% feature importance), ACWR (16.2%) and morning HRV (13.8%). Player Load and TRIMP correlated strongly with each other (r = 0.81) — neither alone is enough to detect fatigue.
ACWR & AUC — briefly explained
ACWR (Acute:Chronic Workload Ratio) compares your training load of the last week to the average of the last four weeks. Above 1.3 is considered a risk zone, below 0.8 underloading. AUC (Area Under the Curve) measures the quality of a classification model: 0.5 equals chance, 1.0 would be perfect prediction. 0.895 is strong.
WHAT IS XGBOOST?
XGBoost (Extreme Gradient Boosting) is an established machine learning algorithm that combines many weak prediction models step by step into a strong one. Not an in-house development by the study authors — but one of the most widely used tools in applied data analysis, open source since 2014.
Which of these markers you can already measure today
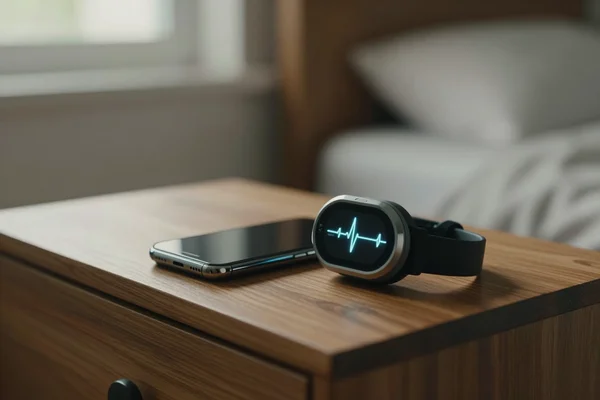
The three most important features in the model are not a pro-athlete exclusive. Morning HRV is delivered by Garmin watches from the Forerunner series onwards, by Polar via Nightly Recharge, by Whoop via its Recovery metric and by the Apple Watch via the Health app. The wellness score takes 30 seconds to log yourself — sleep, muscle soreness, stress, fatigue, each on a short scale. ACWR is calculated automatically in the background by Garmin, Polar Training Load Pro and Whoop.
NO WEARABLE? MORNING PULSE IS ENOUGH
If you do not have a smartwatch, your morning resting pulse gets you surprisingly far: feel your pulse for 10 seconds, multiply by 6, note the value. If it stays 5–8 beats above your personal baseline, that is a clear recovery deficit signal — valid enough to adjust the day's training intensity.
Marker | What it measures | Device / source |
|---|
Morning HRV | Recovery of the autonomic nervous system | Garmin, Polar (Nightly Recharge), Whoop, Apple Watch, Elite HRV + chest strap |
ACWR | Acute vs. chronic training load | Garmin (Training Load), Polar Training Load Pro, Whoop |
Wellness score | Subjective state: sleep, soreness, stress | Manual; HRV4Training, TrainingPeaks, Notion |
RPE | Perceived exertion after training | Manual (Borg scale); Garmin and Polar prompt automatically after training |
CMJ height | Neuromuscular readiness (fatigue validation) | Polar Vantage V3 (built-in), MyJump Lab 2.0 (smartphone app) |
CMJ as a fatigue marker — and who it is actually useful for
The study uses CMJ as one of four fatigue validation criteria — for football players, who rely on explosive strength daily, a sensible choice. What the study does not address, and what I flag here as my own assessment: the jump test is not equally meaningful for every athlete.
For strength athletes planning heavy compound lifts on the day, CMJ makes sense as a daily readiness check: it measures neuromuscular readiness — exactly what maximal strength training demands. A measurable drop below your personal baseline signals elevated CNS fatigue before you notice it in training. For endurance athletes the picture is less clear-cut: running fatigue is predominantly metabolic in nature, and CMJ values often stay stable after submaximal sessions or even rise slightly through short-term neuromuscular potentiation. There, morning HRV and wellness score provide far more reliable signals.
CMJ can be measured with the MyJump Lab 2.0 app via smartphone camera — or directly through the Polar Vantage V3, which includes a built-in jump test. The latter is independently validated: a study from the University of Konstanz (Bubeck et al., 2022) compared the predecessor Vantage V2 against force plates — the average deviation was under one centimetre. For day-to-day baseline comparison that is more than enough. Whether Polar V3 and MyJump line up head-to-head I have not yet tested — worth its own article.
LIMITS OF TRANSFERABILITY
48 male college football players, a sport with a specific load structure — whether wellness score, ACWR and HRV are the most important fatigue markers in other disciplines as well, the study leaves open. For endurance or strength athletes, other features could weigh more heavily.
What remains open
48 players, all male, one sport — whether the feature importance distribution looks similar in other contexts the study leaves open. What you take away directly: the three prioritised markers — and the insight that the subjective wellness score was more important in the model than any GPS metric.
Sources
Xu X et al. (2026). Multi-sensor fusion outperforms single indicators for fatigue prediction in university soccer players: a machine learning approach. Frontiers in Physiology, 17:1775906. DOI: 10.3389/fphys.2026.1775906. PMC: PMC12956510.