A load-velocity profile built from a few submaximal sets can estimate high training intensities in the deadlift with an error of roughly 4 %. That is what a recent study in the Journal of Sports Science and Medicine (Li et al., 2026) shows. For intensities around 80–90 % of 1RM the accuracy is acceptable – without you ever having to push a maximum rep.
The bad news: below 70 % 1RM the method becomes imprecise. And it does not fully replace a true 1RM. But that is exactly what makes the results credible – because the authors are honest about where the limits lie.
At a glance
30 trained athletes (15 women, 15 men), conventional deadlift up to 1RM: the load-intercept L₀ – the theoretical maximum load derived from the velocity curve – is stable enough (ICC 0.97, CV ~5 %) to estimate intensities from 80 % 1RM upwards with ≤ 4 % error. Below 70 % 1RM the error rises above 6 %. L₀ does not replace the 1RM, but it offers a practical alternative for strength-oriented training – especially when regular maximal tests are not sensible.
Stay on top of AI training & analysis? One click — and Google shows you my articles first.
The team around Zhaoqian Li (Shandong University, with collaboration from the University of Granada) wanted to know whether training intensity in the deadlift can be managed via the load-velocity relationship (L-V relationship) – without having to measure the 1RM directly beforehand. The central value for this: the load-intercept L₀.
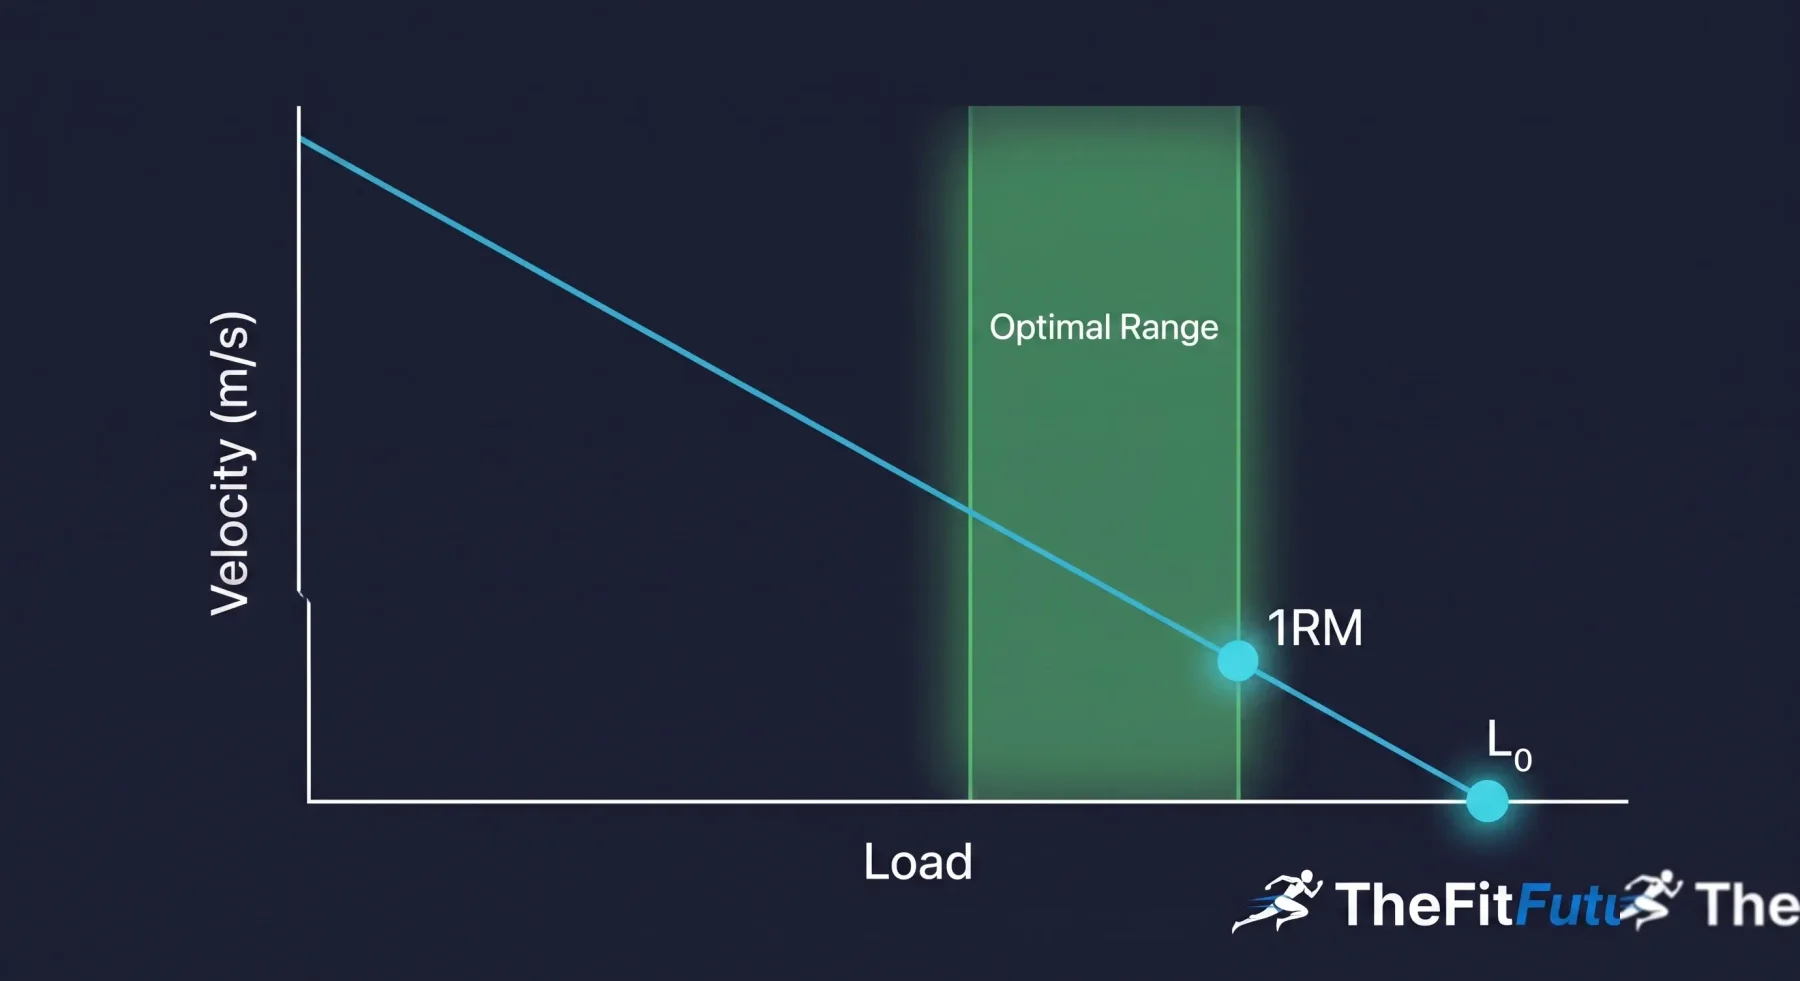
L₀ is the theoretical load at which bar velocity would drop to zero. You calculate it from the linear regression of load against velocity – that is, from the data points you collect across submaximal sets with increasing load. Unlike with the 1RM, you do not have to push all the way to the absolute limit.
LOAD-INTERCEPT L₀ – BRIEFLY EXPLAINED
Picture a chart: the x-axis is the load in kg, the y-axis is mean velocity. The heavier the load, the slower – that produces a descending line. L₀ is the point where this line meets the x-axis: the load at which you would theoretically reach zero velocity. L₀ always sits slightly above your actual 1RM, because at your 1RM you still have a minimal velocity (roughly 0.25 m/s in the deadlift).
The load-velocity relationship in the deadlift: the heavier the load, the slower the bar. L₀ is the theoretical load at zero velocity – the optimum range for VBT monitoring lies between 80–90 % 1RM.
Study design: who, what, how?
30 well-trained athletes – 15 men (deadlift 1RM ~175 kg, all above 1.5× body weight) and 15 women (1RM ~106 kg) – completed two identical test sessions three to seven days apart. Each session: warm-up, then deadlifts at roughly 40 %, 60 %, 70 %, 80 % and 90 % of estimated 1RM with maximal intended velocity, followed by actual 1RM testing.
Velocity was measured with a GymAware PowerTool – a linear position transducer considered the gold standard in VBT research. From the data, the researchers calculated three regression models per person and session: absolute (load vs. velocity), relative to 1RM (%1RM vs. velocity) and relative to L₀ (%L₀ vs. velocity).
The results: where L₀ works – and where it doesn't
L₀ showed acceptable between-session reliability: CV of ~5 % and ICC of 0.974. That is slightly worse than the direct 1RM (CV 3.5 %, ICC 0.989), but still usable in practice. The 1RM/L₀ ratio was relatively constant between individuals (CV ~6 %), which means: the relationship between the true maximum and the calculated L₀ does not fluctuate wildly between different athletes.
Variable
CV (within-subject)
ICC
Assessment
1RM
3.48 %
0.989
Gold standard, very stable
L₀ (load-intercept)
4.98 %
0.974
Acceptable, slightly more variable
v₀ (velocity-intercept)
4.64 %
0.838
Less stable, higher spread
1RM/L₀ ratio
3.01 %
0.817
Stable between individuals (CV 6.4 %)
But the decisive question is not the reliability of L₀ itself, it is how well the method predicts intensities in practice. And here things get nuanced.
At high intensities – from around 80 % 1RM upwards – the absolute error of the %L₀-MV relationship was ≤ 4.05 %. In practice that corresponds to a deviation of a few kilograms. At loads around 40–70 % 1RM the error climbed above 6.3 % – there the method is not usable for precise intensity management. The %1RM-MV relationship was more accurate at lighter loads, but at 90 % 1RM the picture flipped: there the L₀-based method was even more stable.
Intensity range
Error %1RM-MV
Error %L₀-MV
Practical usability
~40 % 1RM (load 1)
10.1 %
11.8 %
Not suitable
~60 % 1RM (load 2)
6.4 %
7.8 %
Borderline
~70 % 1RM (load 3)
6.3 %
7.4 %
Borderline
~80 % 1RM (load 4)
3.4 %
4.1 %
Acceptable
~90 % 1RM (load 5)
2.4 %
2.4 %
Good – no difference
What does this mean for your training?
A real 1RM test in the deadlift is no joke. High spinal load, injury risk on a bad day, and for most recreational athletes simply unnecessary. If you train three to four times a week and want to get stronger, you don't need maximal attempts – you need reliable intensity management in the ranges that matter for building strength: 80–90 % 1RM.
That is exactly where the L₀ method delivers. Instead of wrecking yourself with 1RM tests, you run a few clean sets with increasing load, measure the velocity – and get an estimate of your current capacity that varies across good and bad days. That is autoregulation driven by data instead of gut feeling.
What this looks like in practice
Step 1 – Build your velocity profile: You need some form of velocity tracking – GymAware, Vitruve, a camera app such as Metric VBT or RepOne. After warming up, you perform 3–5 sets of deadlifts with increasing load (e.g. at estimated 60 %, 70 %, 80 %, 90 %), every rep clean and with full intent, no grind reps. The app or device uses the data to calculate your individual load-velocity curve and L₀.
Step 2 – Target velocity instead of target weight: From your profile you know which velocity corresponds to which intensity. Instead of “140 kg today” you say “0.35–0.45 m/s today” – that roughly matches 80–90 % of your current maximum. On good days you hit that velocity with more weight, on bad days with less. The intensity stays in the target zone.
Step 3 – Velocity loss as a safety net: If velocity drops sharply within a set, you stop – instead of grinding into technically ugly failure. Especially in the deadlift, that protects your back, connective tissue and nervous system.
HOW DO YOU MEASURE BAR VELOCITY?
The study used a GymAware PowerTool (~€2,000) – you do not need that. For recreational athletes there are three categories: smartphone apps with camera tracking (Metric VBT, RepOne), affordable sensors on the wrist or the bar (Vitruve, ~€300), and DIY solutions via video analysis. All of them involve trade-offs in accuracy and convenience – but for trend analysis and autoregulation they are enough.
WHY NOT JUST USE RPE?
RPE (rate of perceived exertion) is subjective – and in the deadlift often unreliable, because heavy singles and doubles feel different from how they actually fatigue you. Velocity tracking delivers an objective signal: the bar doesn't lie. That makes the difference especially on days when your feeling diverges from reality.
Critical assessment
The study is cleanly designed: repeated-measures design, GymAware as the measurement device, both sexes, transparent statistics. The authors name the weaknesses themselves – and that is a good sign. Still, there are points to keep in mind.
The L-V modelling was still tied to the 1RM. The test loads were defined as percentages of the estimated 1RM, and the actual 1RM was measured in every session. In practice you often don't have that reference 1RM – you only work with estimated loads. The authors acknowledge this and call for follow-up studies that validate L₀ entirely without a 1RM measurement.
On top of that: the subjects were well-trained athletes with deadlift 1RMs clearly above 1.5× body weight. Whether the results transfer to beginners or less trained individuals remains open. In beginners, both technique and strength fluctuate more from session to session – that should make L₀ less stable.
And the fundamental limitation: below 80 % 1RM the error rate is too high. Anyone who wants to use VBT for lighter hypertrophy work in the deadlift (e.g. 60–70 % 1RM) needs a different approach – for example direct velocity zones instead of L₀-based percentage estimates.
VBT building block 2: manage intensity instead of optimising volume
Put together, the picture is clear: VBT is not a single concept, it is a toolbox. For the bench press you use velocity data to squeeze more out of your sets. For deadlifts you use it to land on the right weight without having to attempt a maximum.
VBT AND AI: THE FITFUTURIST ANGLE
Load-velocity profiles generate exactly the kind of structured data that an LLM can process meaningfully: time series, linear regressions, between-session comparisons. You can hand Claude or ChatGPT your velocity data from 4–6 weeks and ask questions like: “Has my L₀ gone up across the weeks?”, “Estimate my current 1RM based on the trend” or “When should I recalibrate my profile?” That does not replace a coach – but it makes you more independent.
Bottom line
Li et al. show that the load-intercept L₀ from the load-velocity relationship in the deadlift is a practical alternative to the 1RM test – with one caveat: the accuracy is only good enough for high intensities from 80 % 1RM upwards. For strength development that is precisely the range you want to work in. For lighter work you need other methods.
For recreational athletes who aren't prepping a competition deadlift, the core message is simple: you don't have to test your 1RM regularly. A handful of submaximal sets with velocity measurement is enough to keep your training in the right intensity zone. Less risk, less fatigue, still hard sessions.
VBT here does not mean: fancy tech for tech's sake. It means: less risk, same or better training quality. The bar doesn't lie – but you still have to be able to read the data.
Source: Li Z, Chang Q, Chen Z, Yang L, Zhang X, Li R, Zhang H. Monitoring Resistance Training Intensity Using Load-Intercept from The Load-Velocity Relationship Variables: The Case of Deadlift. J Sports Sci Med. 2026;25:282-290. DOI: 10.52082/jssm.2026.282 | Open access at JSSM